The Volatility Index (or VIX) is a weighted measure of the implied volatility for SPX put and call options. The puts and calls are weighted according to time remaining and the degree to which they are in or out of the money.
There are various ways of extracting the volatility information from option prices. The standard way is via the Black & Scholes model, but those equations assume that volatility will be the same for all available options—something that is definitely NOT the case.
Contrary to what many people believe, the VIX is NOT calculated using Black-Scholes or any other option pricing model.
Instead, the VIX is calculated using a Variance Swap formula which directly derives variance from the whole set of prices of options with the same time to expiration.

Specifically, the VIX is the square root of the annualized forward price of the 30-day variance of the S&P 500 return. This forward price is based on the replication of total variance by a portfolio of options delta-hedged with stock index futures. VIX is obtained as the square root of the price of variance. The price of variance is derived as the forward price of a particular strip of SPX options, where the variance is replicated by delta-hedging the options in the strip.
Two different variances for two different times to expiration are then interpolated or extrapolated to get 30-day variance. This variance is then transformed into standard deviation (by taking the square root) and multiplied by 100.

There’s nothing magical about the 30 day estimate. The CBOE uses the same methodology to compute 9 day (VXST), 93 day (VXV), and 180 day (VXMT) volatility indexes.
Fortunately, you don’t need to understand any of the math behind the formula. All of these complex calculations are available on the OptionStack platform with a click of the mouse.
Example
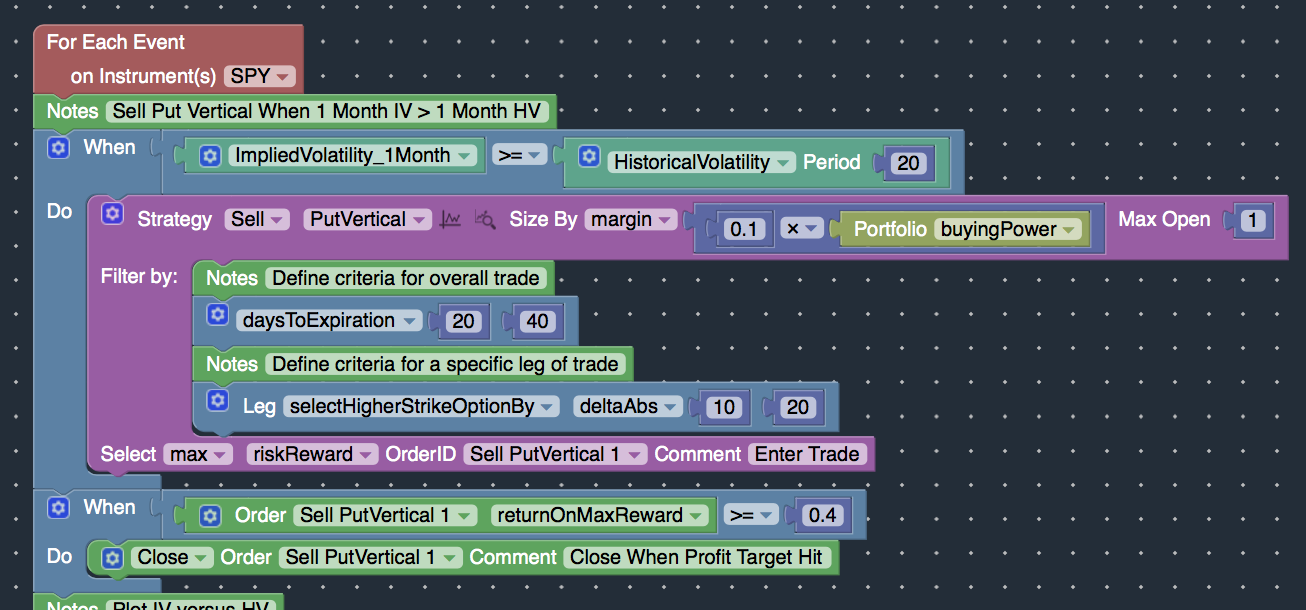
The example below demonstrates how to leverage various implied volatility studies in your strategies. Specifically, the strategy will sell put vertical spreads whenever the 1 Month Implied Volatility is greater than the 1 Month Historical Volatility.

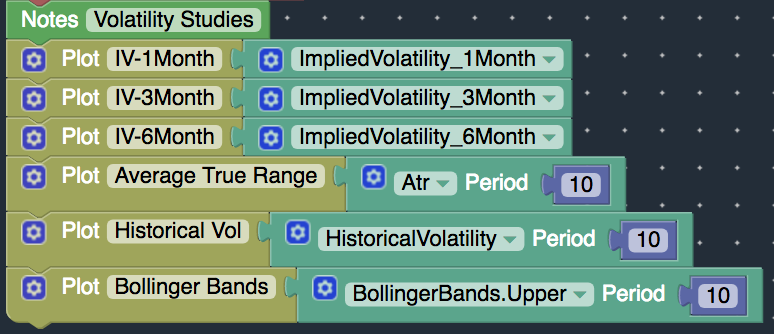
Several volatility studies are available on the OptionStack platform, including:
- ImpliedVolatility_1Month – 1 month IV
- ImpliedVolatility_3Month – 3 month IV
- ImpliedVolatility_6Month – 6 month IV
- Custom Volatility – create your own volatility study
- Other Volatility Studies – other volatility studies such as Bollinger Bands, Average True Range, etc.

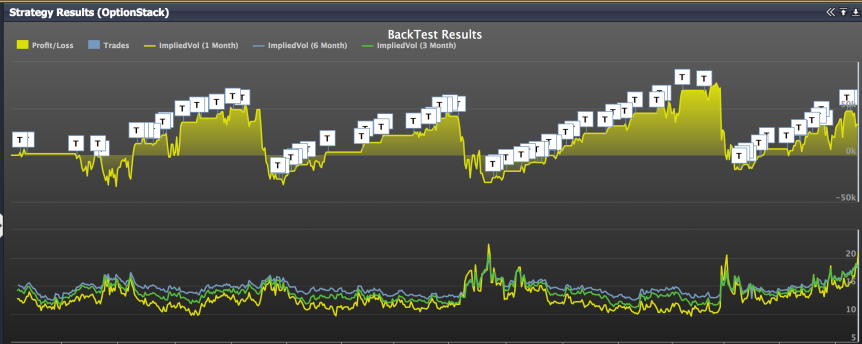
To view the performance of this strategy or to create your own volatility strategy, sign up today and then click the “Run Backtest” button.

