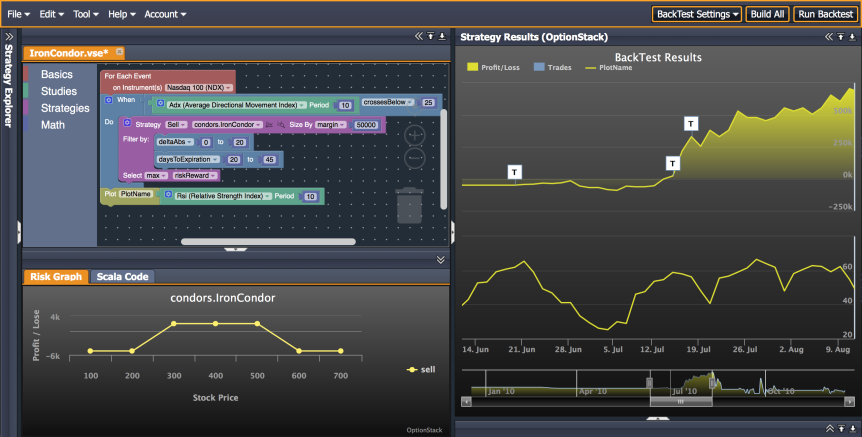
At OptionStack, our engineers and traders are working feverishly to build the most powerful analytics platform for stock and options traders. Each release brings some very exciting developments to the OptionStack platform.
Basket Trading
- Basket Trading – backtest your strategies against a basket of 100+ instruments simultaneously.
- More Volatility Studies – implied volatility studies for 1 month / 3 month / 6 month terms
Earnings Strategies
- Earnings Strategies – backtest various earnings-related strategies, including trading straddles / condors / verticals before and after earnings announcements.
- Portfolio Rebalancing Strategies – support for different rebalancing strategies, including Calendar-Based Rebalancing, Percentage Composition Rebalancing, etc.
More Strategies
- Unbalanced Butterflies Strategies – Support for Broken Wing Butterflies, Skip Strike Butterflies, 1x3x2 Butterflies, etc..
- Position Sizing Strategies – support for a variety of different position sizing strategies including margin, risk, cost, etc.
Studies + Help
- More examples and tutorials to help you quickly build your trading models
- New technical studies and calendar-based studies
- Run unlimited quick backtests via “Build Strategy” so you can build and optimize quickly
- Enhanced context-sensitive help with documentation at your fingertips.
- Improved platform performance and stability
Rolling Positions
- You can adjust your positions by rolling your prior trades into new positions for a net cost.
- For instance, you can define rules to adjust your short options when they become in-the-money (ITM) by rolling them further out-of-the money (OTM) for net zero cost.

Adjust Positions
- You can adjust your positions based on additional market conditions, such as achieving certain profit or loss targets, crossing the short strikes, etc..
- For instance, you can define rules to close your position if the short strikes are touched or if profit/loss is greater than 75%.

View Portfolio
- You can view your portfolio across different points in time
- Double-click on a specific date in the “Statistics” table or transaction in the “Transactions” table to view portfolio at that time.
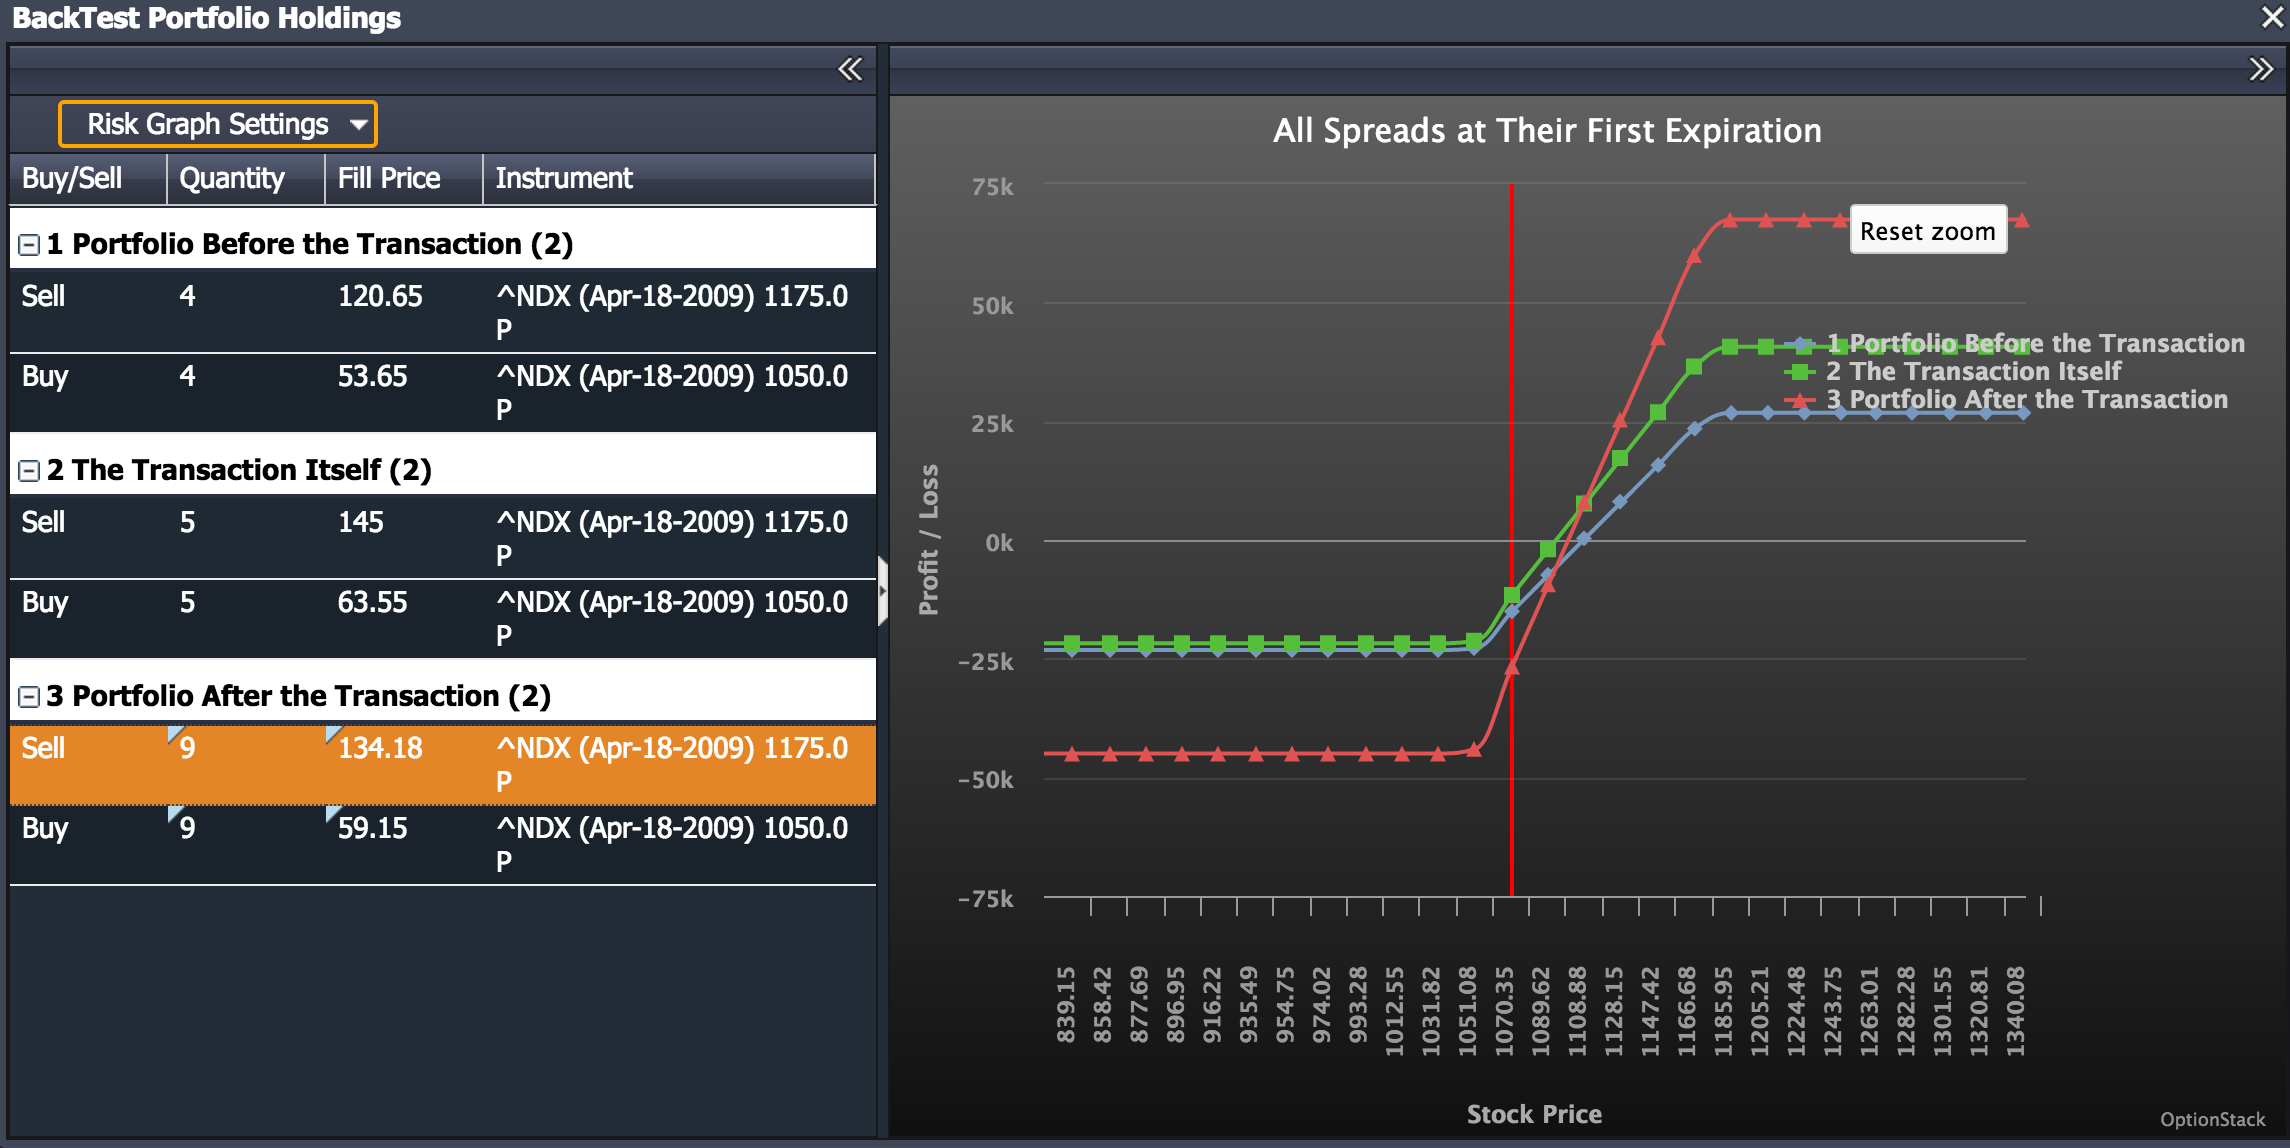
- Compare how your portfolio changes before and after a transaction has occurred.
Risk Graphs
- You can view detailed risk graphs of individual transactions by double-clicking on transaction rows in the Transactions Table
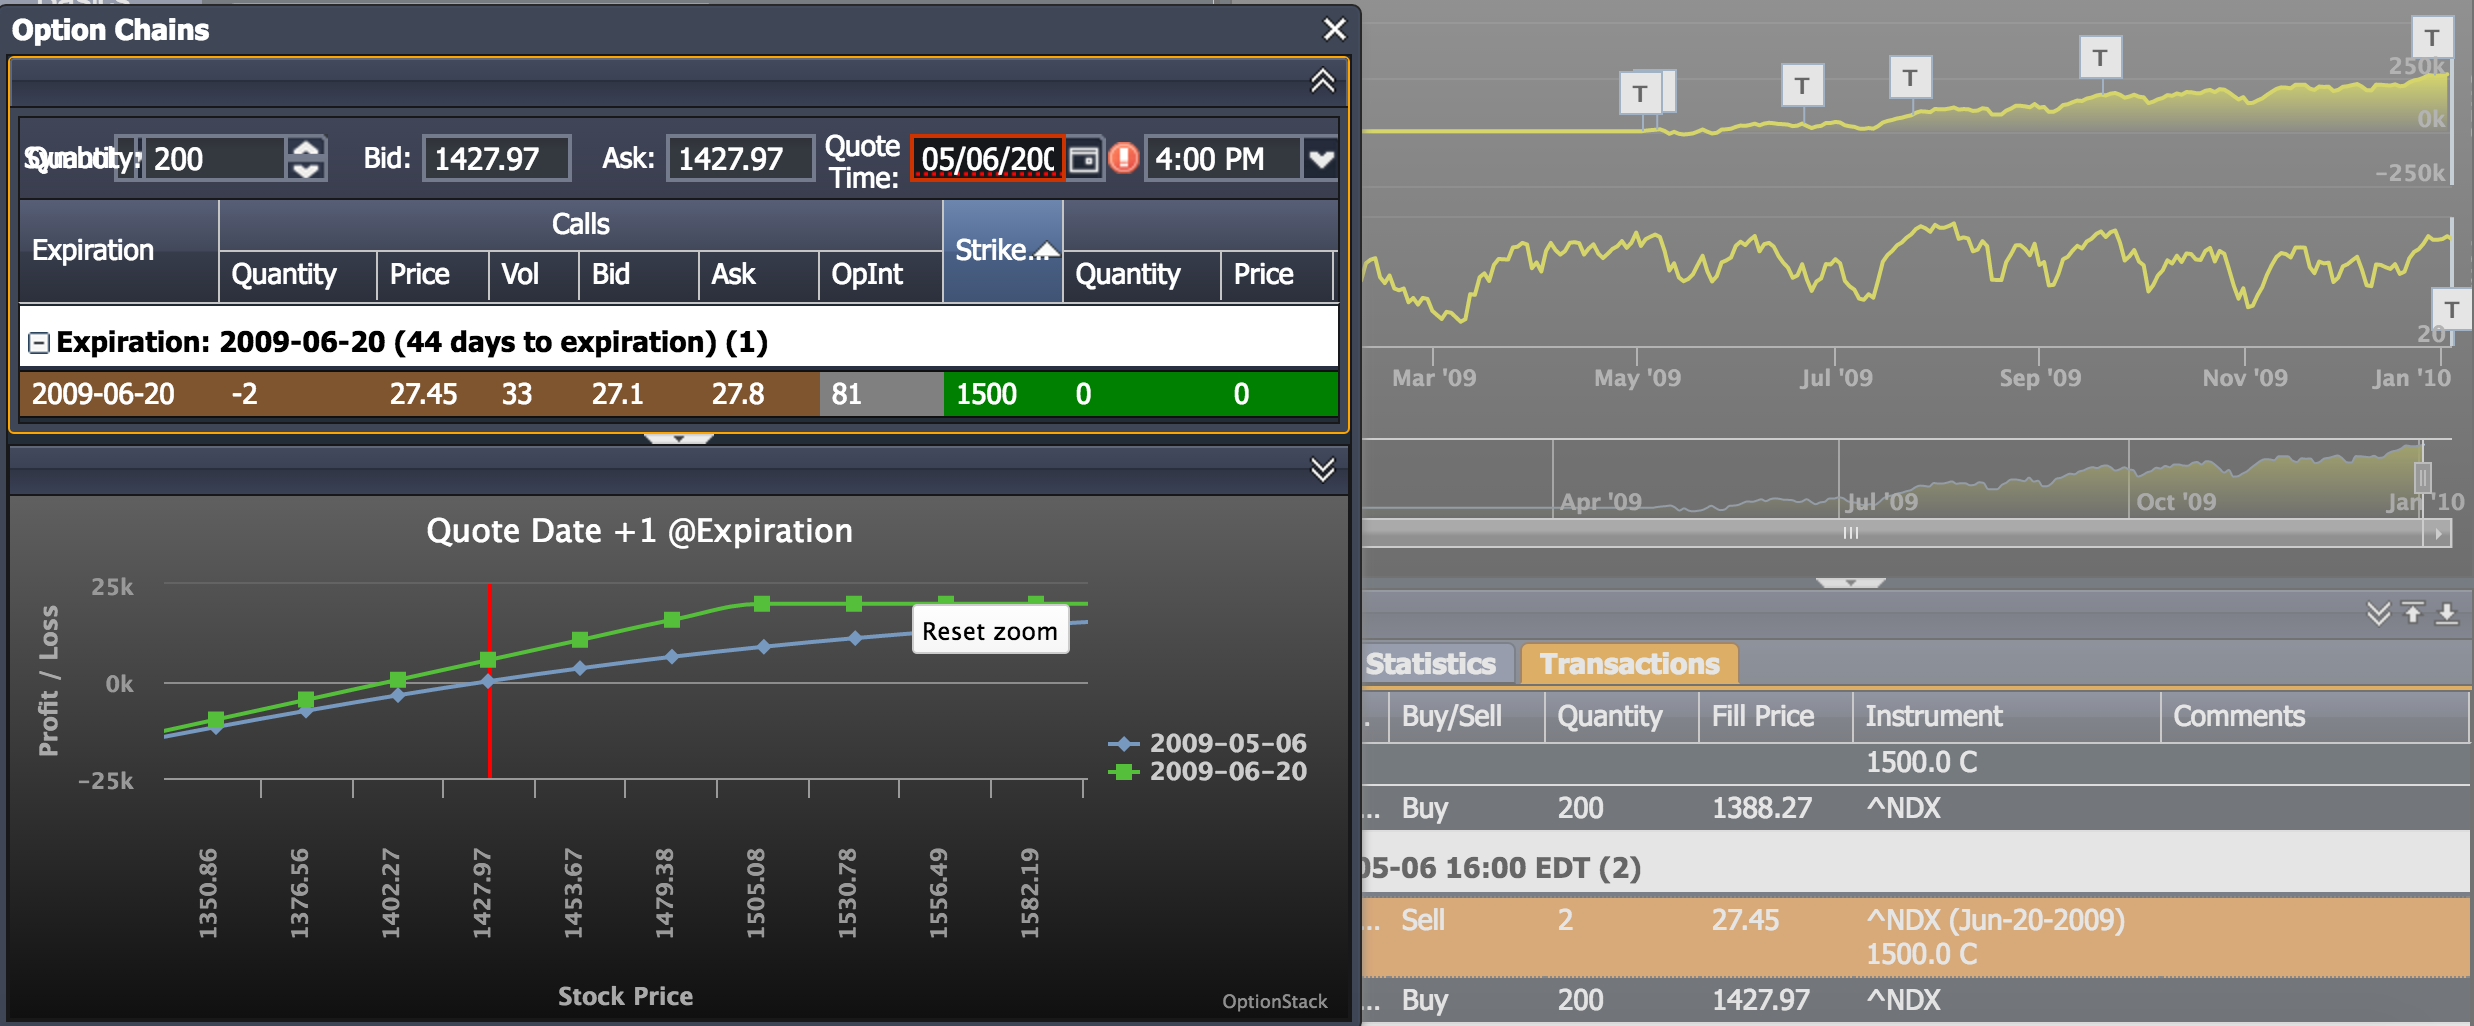
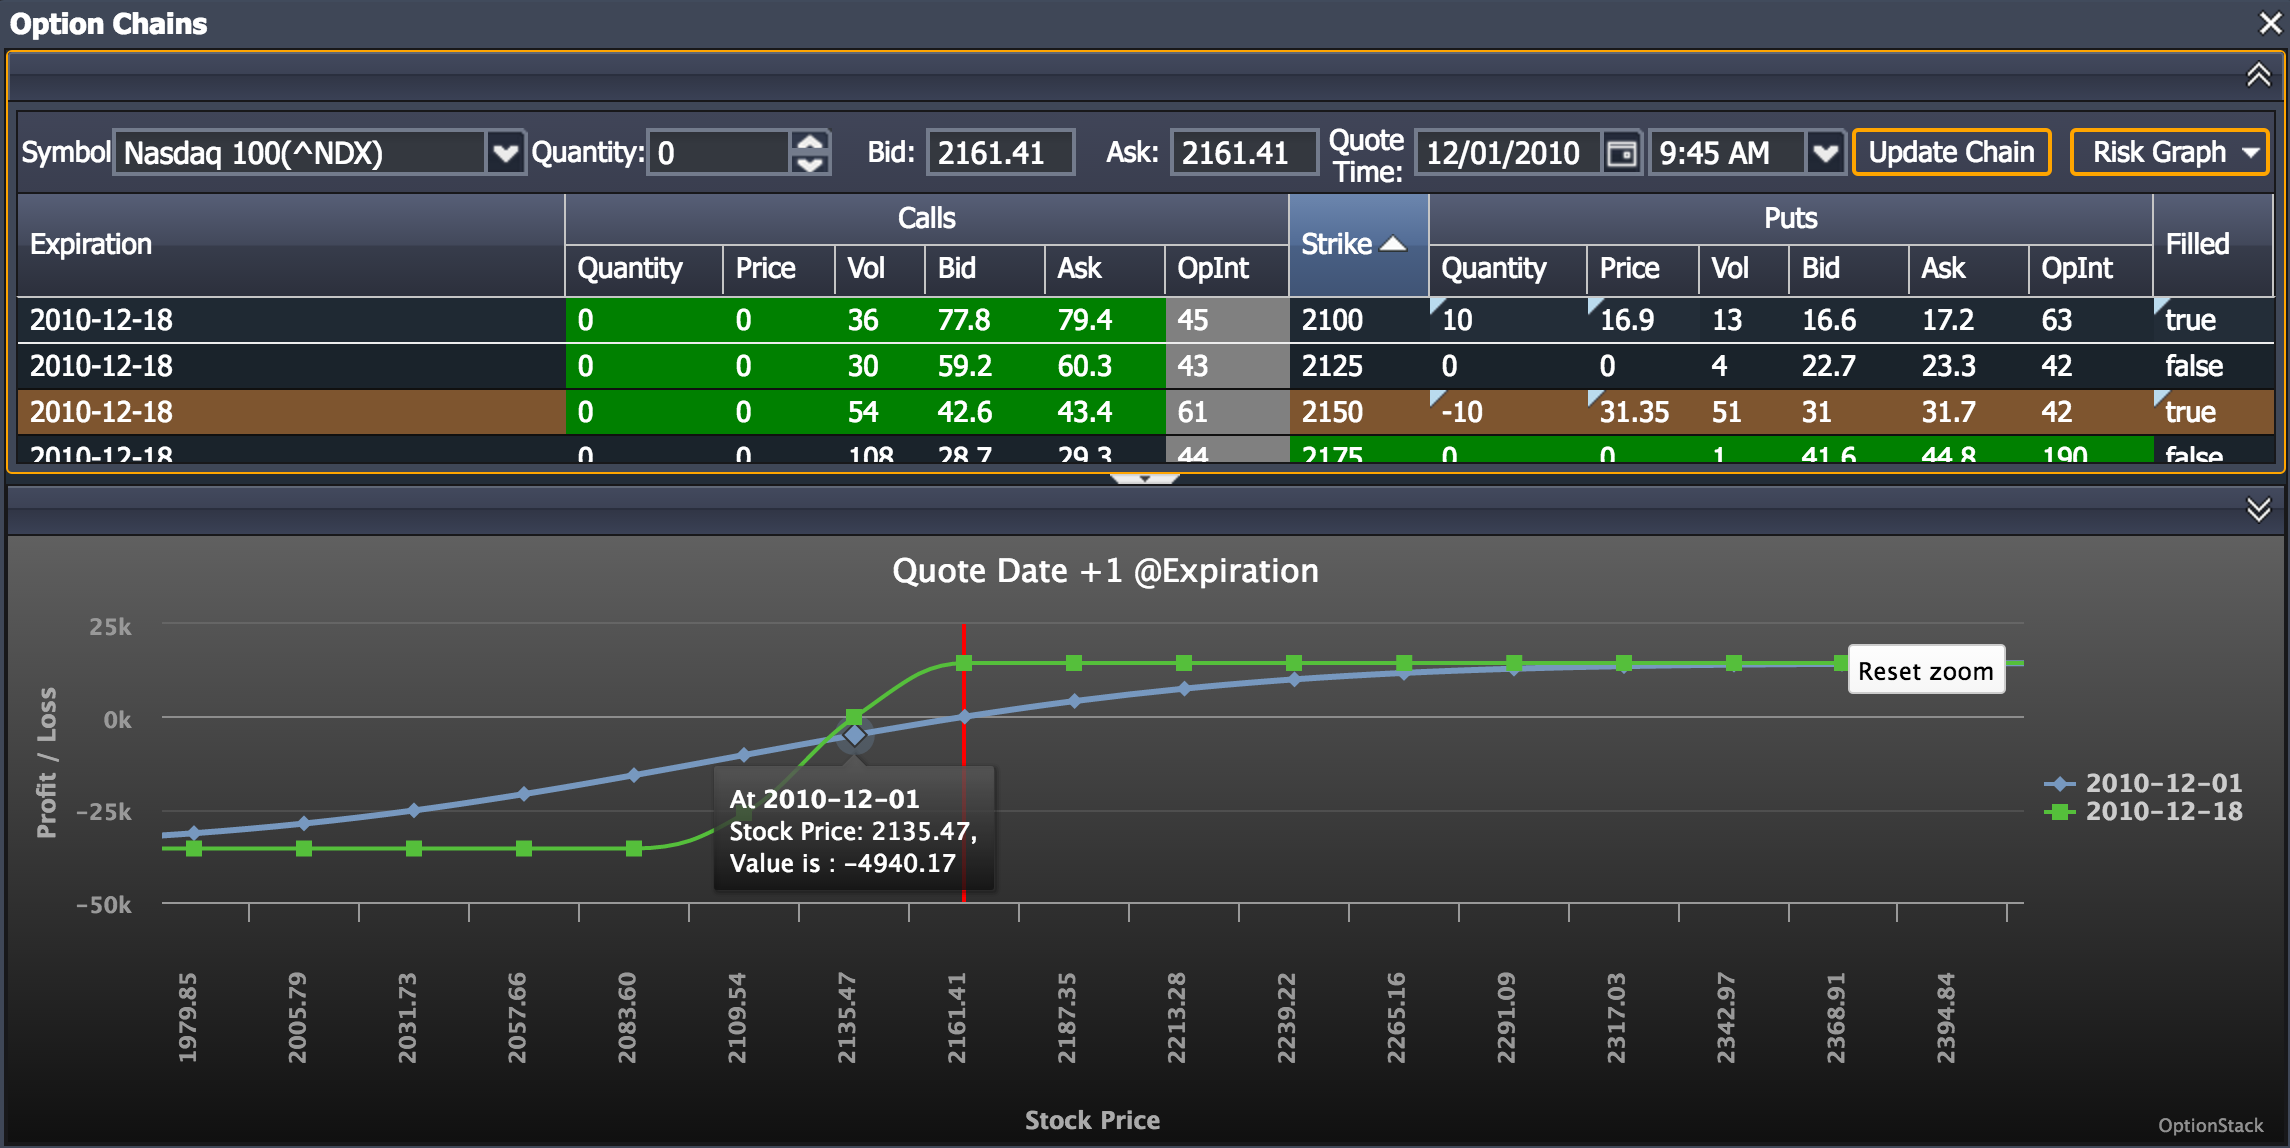
- You can also view Risk Graphs via our Option Chain Tool. Click on the “Option Chain” from the Tool Menu, and then adjust the quantities of the desired options to buy / sell.
Option Strategies
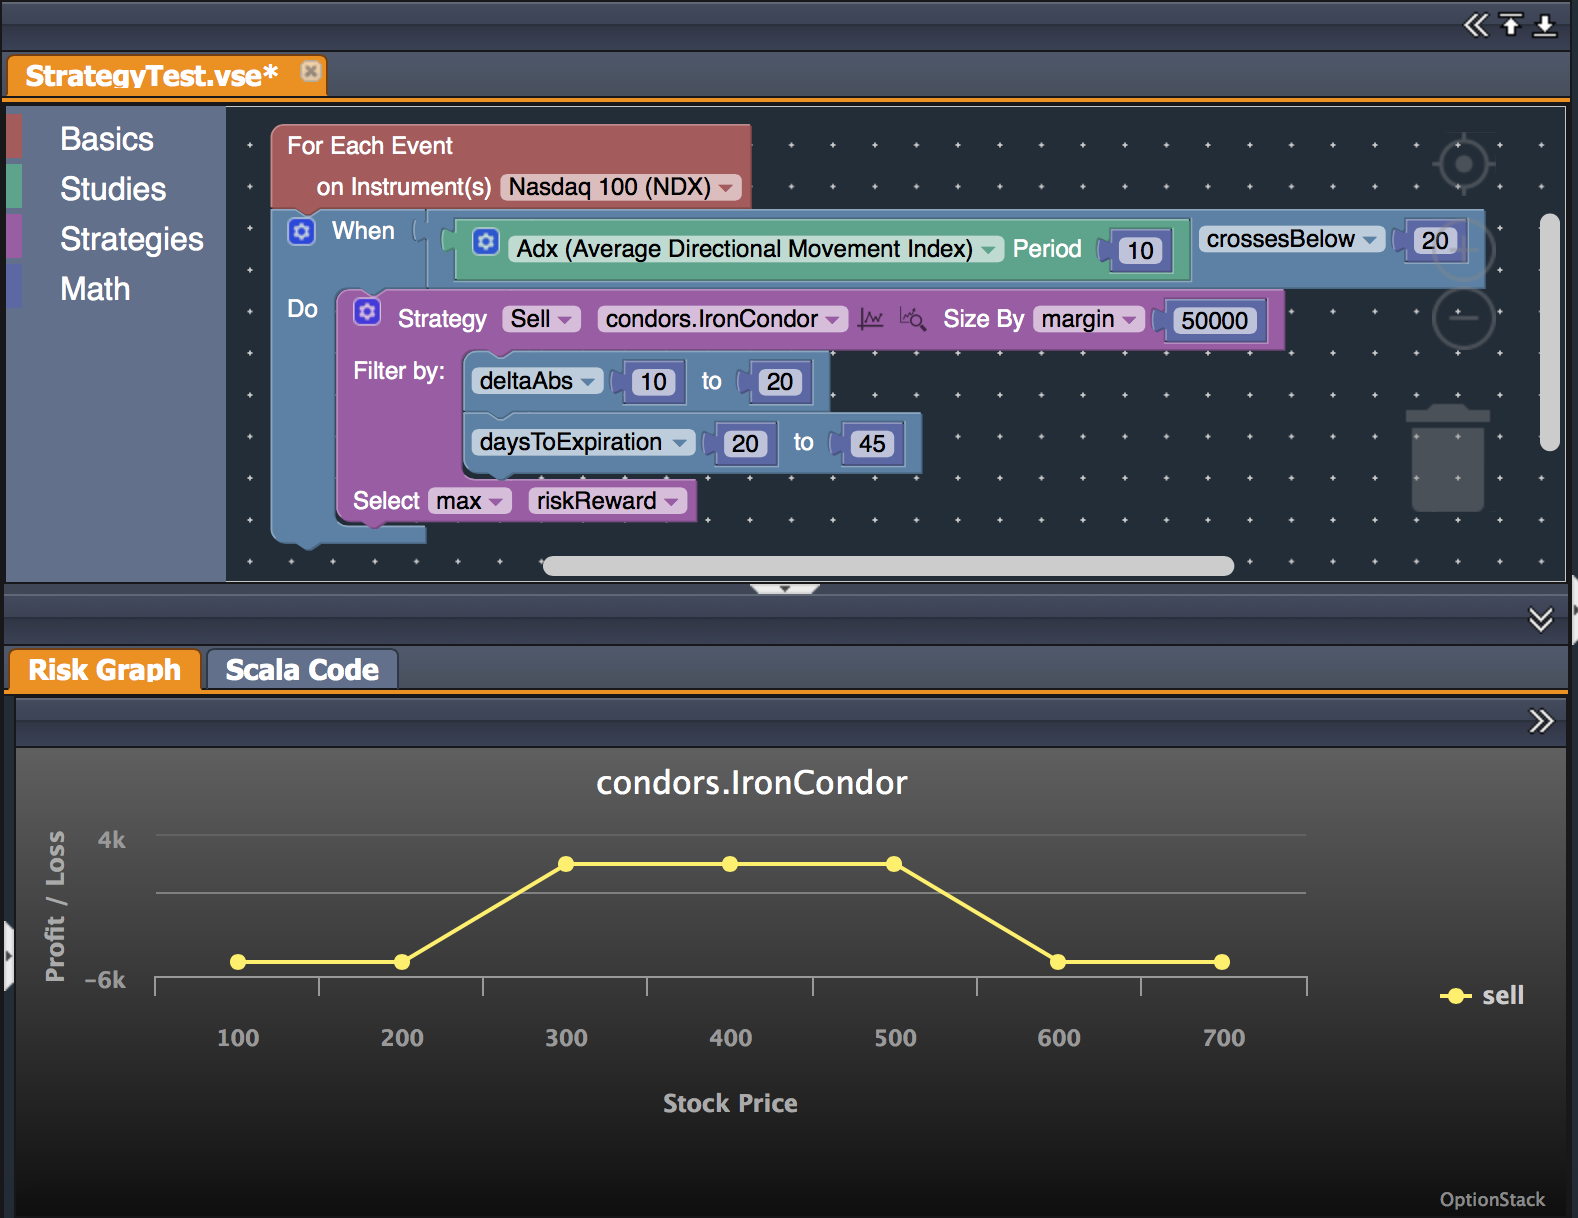
- You can create complex options strategies by dragging and dropping the desired filters into the “Strategy block“
- Once you create your option strategy, you can click on the “Magnifying Glass” icon to view the risk graphs of the selected option strategies.


Option Chains
- View the Option Chain at any specific date from the “Option Chain” Tool menu.
- Change the quantities of the stock / options directly on the option chain to view the corresponding risk graph of the positions.
Drag & Drop
- Create trading strategies using our Drag and Drop Editor.
- Support for over 150+ technical, statistical, and volatility studies
- Support for over a dozen different option strategies (stock, covered call, collars, vertical, straddle, butterfly, condors, etc..)
- Support for sophisticated position sizing methods (quantity, risk, margin, delta, etc)
